Every Deployment in this series has carried a line like this:
spec:
  replicas: 3
Three. Not two, not seven. A number someone typed once and never revisited. If traffic triples at 9pm, three pods is wrong. If the app sits idle all weekend, three pods is also wrong, just wrong in the direction that costs money instead of uptime.
This post replaces that number with a decision the cluster makes. Getting there takes three pieces: resource requests and limits so the cluster knows what a pod needs, the metrics-server so it knows what a pod is currently using, and the HorizontalPodAutoscaler that compares the two and adjusts the replica count.
We’re on DigitalOcean again, same as Parts 3, 4 and 6. Three nodes, s-2vcpu-4gb each, small enough that resource numbers bite:
kubectl get nodesNAME STATUS ROLES AGE VERSION
pool-8kf2qm1xw-a4zt7 Ready <none> 3m v1.33.1
pool-8kf2qm1xw-a4zt9 Ready <none> 3m v1.33.1
pool-8kf2qm1xw-a4ztd Ready <none> 3m v1.33.1Nothing in this post creates a load balancer or a volume, so the cluster itself is the only thing billing you. Destroy it at the end.
1. Requests and limits
Every container can declare two numbers for each resource:
resources:
  requests:
    cpu: 100m
    memory: 128Mi
  limits:
    cpu: 500m
    memory: 256Mi
They look like a pair of bounds on the same thing. They aren’t. Two different components read them, at different times, for different reasons.
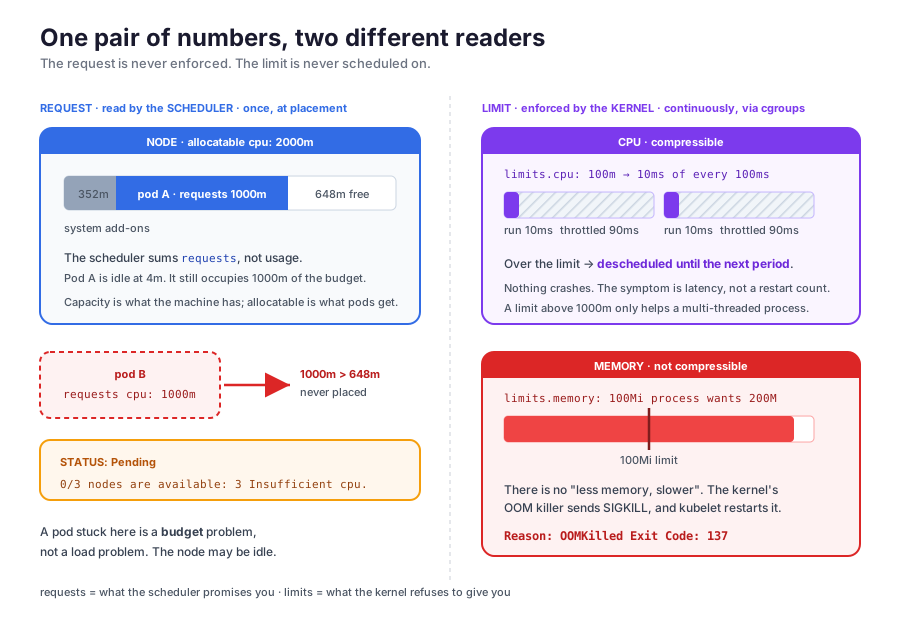
The request is a scheduling number. When the scheduler picks a node for a pod, it adds up the requests of everything already assigned to that node, compares against the node’s allocatable capacity, and only places the pod where the sum still fits. That’s the entire role of a request. The scheduler never looks at what a pod is actually using. A container requesting 2 CPU and using none still occupies 2 CPU of the node’s budget as far as placement goes.
The limit is a runtime ceiling. The kernel enforces it on the node, through cgroups, on the running process. The scheduler doesn’t consider it at all.
What the CPU number actually means
CPU is measured in CPU units, where 1 means one core’s worth of CPU time. One vCPU on a cloud instance, one hyperthread on your laptop, whatever the machine calls a core. Our s-2vcpu-4gb nodes have 2.
The m suffix is millicores, thousandths of a core. 1000m is one core, 500m is half a core, 100m is a tenth. You’ll see m almost everywhere in real manifests, because most containers want a fraction of a core and 100m reads better than 0.1.
CPU isn’t sliced by handing your process one particular core. It’s sliced by time. The kernel’s scheduler works in periods of 100ms, and a limit of 100m means the container’s processes get a quota of 10ms of CPU time in every 100ms period. Burn through the 10ms and the kernel throttles the container, descheduling it until the next period begins.
So a 100m limit doesn’t make your code run at one-tenth speed evenly. It makes your code run at full speed for 10ms, freeze for 90ms, run for 10ms, freeze. For a web request that means latency, not failure. A limit above 1000m is meaningful too. 2000m means the container can use 200ms of CPU time per 100ms period, which only works if its work is spread across at least two threads on two cores.
Memory is simpler. 128Mi is 128 mebibytes, 128 × 1024². The suffixes without the i are powers of ten, so 128M is 128,000,000 bytes, about 5MB less. Use Mi and Gi.
Throttled vs killed
The two resources fail differently.
CPU is compressible. Exceed the limit and you get throttled, slowed down but never killed. Nothing crashes. Requests just get slower. The symptom of a too-low CPU limit is a latency graph, not a restart count.
Memory is not compressible. There’s no way to give a process “less memory, slower.” Cross the memory limit and the kernel’s OOM killer terminates the container. Kubernetes restarts it and records the reason as OOMKilled.
Watch that happen. memory-hog.yaml:
apiVersion: v1
kind: Pod
metadata:
  name: memory-hog
spec:
  containers:
    - name: hog
      image: polinux/stress
      command: ["stress"]
      args: ["--vm", "1", "--vm-bytes", "200M", "--vm-hang", "1"]
      resources:
        requests:
          memory: 64Mi
        limits:
          memory: 100Mi
kubectl apply -f memory-hog.yaml
kubectl get pod memory-hog -wNAME READY STATUS RESTARTS AGE
memory-hog 0/1 OOMKilled 1 (5s ago) 20s
memory-hog 0/1 CrashLoopBackOff 1 35sThe container asked the kernel for 200MB with a 100Mi ceiling, and the kernel killed it. kubectl describe pod memory-hog has the receipt:
    Last State:     Terminated
      Reason:       OOMKilled
      Exit Code:    137
Exit code 137 means the container was OOM killed. If you ever see a pod restarting with 137 and nothing in its own logs, that’s why. The application didn’t fail. The kernel stopped it mid-sentence.
kubectl delete pod memory-hogA pod that doesn’t fit
Requests are also the reason pods sometimes never start. Check what a node has to give:
kubectl describe node pool-8kf2qm1xw-a4zt7Capacity:
cpu: 2
memory: 4030184Ki
pods: 110
Allocatable:
cpu: 2
memory: 2612456Ki
pods: 110
Allocated resources:
(Total limits may be over 100 percent, i.e., overcommitted.)
Resource Requests Limits
-------- -------- ------
cpu 352m (17%) 0 (0%)
memory 190Mi (7%) 340Mi (13%)Capacity is what the machine has. Allocatable is what your pods can have. A 4GB node offers about 2.5Gi, because the kubelet reserves the rest for itself, the container runtime, and the OS. Scheduling math runs against allocatable, never capacity. Note also that DigitalOcean’s own add-ons, the CNI, the CSI driver, CoreDNS and kube-proxy, have already claimed 352m before you deploy anything.
Now ask for more than exists. Four pods at 1 CPU each, on three nodes with roughly 1.6 CPU free apiece. greedy.yaml:
apiVersion: apps/v1
kind: Deployment
metadata:
  name: greedy
spec:
  replicas: 4
  selector:
    matchLabels:
      app: greedy
  template:
    metadata:
      labels:
        app: greedy
    spec:
      containers:
        - name: nginx
          image: nginx
          resources:
            requests:
              cpu: "1"
kubectl apply -f greedy.yaml
kubectl get podsNAME READY STATUS RESTARTS AGE
greedy-6d8f9c7b4d-4vqx2 1/1 Running 0 8s
greedy-6d8f9c7b4d-8ktzn 1/1 Running 0 8s
greedy-6d8f9c7b4d-lnc5h 1/1 Running 0 8s
greedy-6d8f9c7b4d-pw6mr 0/1 Pending 0 8sThree placed, one stuck. Each node can hold exactly one, because a second 1000m pod would need 2000m against roughly 1650m free. kubectl describe pod greedy-6d8f9c7b4d-pw6mr says so:
Events:
  Type     Reason            Age   From               Message
  ----     ----              ----  ----               -------
  Warning  FailedScheduling  15s   default-scheduler  0/3 nodes are available: 3 Insufficient cpu.
                                                      preemption: 0/3 nodes are available: 3 No preemption
                                                      victims found for incoming pod.
Insufficient cpu doesn’t mean the nodes are busy. Those nginx pods use almost nothing. It means the requested CPU budget is spent. A Pending pod carrying this event is nearly always a requests problem, not a load problem.
kubectl delete deployment greedyQoS classes
The relationship between a container’s request and its limit puts the pod into one of three QoS classes, short for Quality of Service. You never write the class. Kubernetes derives it from the numbers you already set.
- Guaranteed. Every container sets requests equal to limits, for both CPU and memory. Evicted last.
- Burstable. Requests are set and lower than limits. Can use spare capacity when it exists, and gives it back under pressure.
- BestEffort. No requests or limits at all. First out the door, and invisible to everything in the rest of this post.
The class has nothing to do with the OOM kill we just watched. Crossing your own memory limit gets you killed whatever class you’re in, and Guaranteed buys no protection from it. QoS decides a different question: when the node runs short and the kubelet has to evict somebody to reclaim memory, who does it pick first.
kubectl get pod <name> -o jsonpath='{.status.qosClass}' tells you which one you landed in.
2. metrics-server
Requests and limits are promises. What a pod claims it needs, and what it isn’t allowed to exceed. Neither is a measurement. Nothing so far has told us what a pod is actually using, and an autoscaler that can’t measure has nothing to scale on.
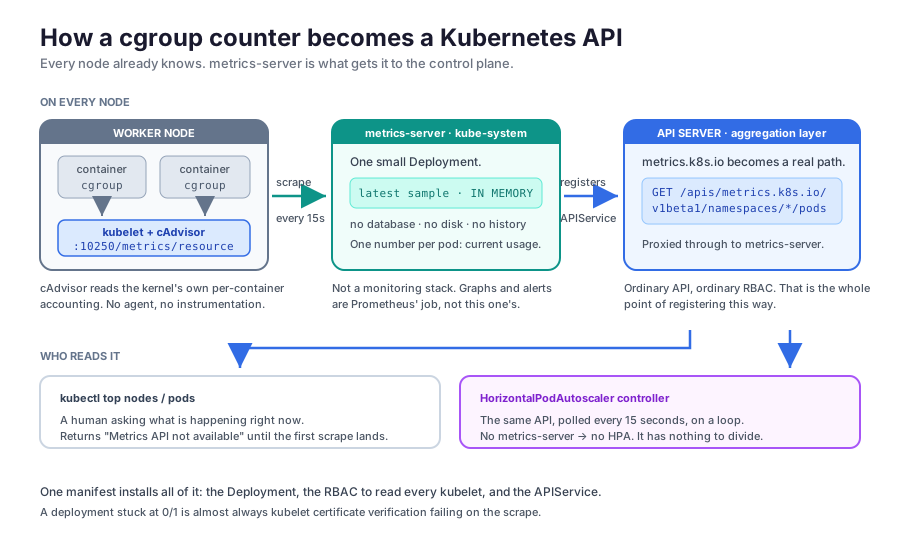
The kubelet on every node already knows. It embeds cAdvisor, which reads the cgroup accounting the kernel keeps for each container, CPU time consumed and memory in use, and exposes it on the kubelet’s own API. The numbers exist on every node in the cluster. They just have no way to reach the control plane.
metrics-server is the piece that closes that gap. It’s a single small Deployment that:
- scrapes every kubelet’s metrics endpoint, by default every 15 seconds,
- keeps the latest sample in memory only, with no database, no disk, no history,
- registers itself with the API server as the
metrics.k8s.ioAPI group.
Clients never poll metrics-server directly. It plugs into the API aggregation layer, so metrics.k8s.io becomes a real path on the API server, and the API server proxies a request like this straight through to it:
GET /apis/metrics.k8s.io/v1beta1/namespaces/default/podsFrom the outside it looks like any other Kubernetes API. That’s what lets kubectl top and the HPA controller read metrics through ordinary API calls and ordinary RBAC.
Install it:
kubectl apply -f https://github.com/kubernetes-sigs/metrics-server/releases/latest/download/components.yamlOne manifest, and it creates a handful of objects. A Deployment, a ServiceAccount, the RBAC to read from every kubelet, and the one that matters, an APIService claiming v1beta1.metrics.k8s.io. That last object is the registration into the aggregation layer:
kubectl get apiservices | grep metricsNAME SERVICE AVAILABLE AGE
v1beta1.metrics.k8s.io kube-system/metrics-server True 40sAVAILABLE True means the API server has a working backend for that path.
kubectl get deployment metrics-server -n kube-systemNAME READY UP-TO-DATE AVAILABLE AGE
metrics-server 1/1 1 1 45sIf it sits at
0/1instead, read its logs. The usual failure isx509: cannot validate certificate ... because it doesn't contain any IP SANs. metrics-server verifies each kubelet’s serving certificate, and on a cluster whose kubelet certs the cluster CA never signed, verification fails. Adding--kubelet-insecure-tlsto the container args gets a local cluster moving. On a real one, fix the certificates. DigitalOcean sets its kubelets up correctly, so this shouldn’t bite here.
Now the numbers come out:
kubectl top nodesNAME CPU(cores) CPU% MEMORY(bytes) MEMORY%
pool-8kf2qm1xw-a4zt7 96m 4% 871Mi 34%
pool-8kf2qm1xw-a4zt9 78m 3% 804Mi 31%
pool-8kf2qm1xw-a4ztd 83m 4% 812Mi 31%kubectl top pods -ANAMESPACE NAME CPU(cores) MEMORY(bytes)
kube-system cilium-4xk9r 21m 182Mi
kube-system coredns-668d6bf9bc-2xqrp 3m 14Mi
kube-system csi-do-node-hlm2v 1m 19Mi
kube-system metrics-server-7d5cf8f9b-lm4wx 5m 21MiAsk for this in the first few seconds after installing and you’ll get error: Metrics API not available, because the first scrape hasn’t landed yet. Wait 15 seconds.
metrics-server is not a monitoring system. It holds one sample per pod, in memory, and forgets it on restart. No history, no query language, no alerting. It exists to answer what a pod is using right now, for the autoscaler and for kubectl top. Anything you want to graph or alert on belongs in Prometheus.
3. Something worth scaling
To watch an autoscaler work we need a workload that burns CPU under load. A dozen lines of Express, index.js:
const express = require('express');
const app = express();

app.get('/', (req, res) => {
  const end = Date.now() + 25;
  while (Date.now() < end) {}   // 25ms of pure CPU
  res.send('ok');
});

app.listen(3000, () => console.log('listening on 3000'));
A package.json with express as the only dependency, and a Dockerfile:
FROM node:20-alpine
WORKDIR /app
COPY package.json .
RUN npm install
COPY index.js .
CMD ["node", "index.js"]
Build and push it. DigitalOcean’s nodes are x86, so on an Apple Silicon machine build for the right architecture or the pods will crash with exec format error:
docker buildx build --platform linux/amd64 -t dheerajsai15/cpu-burner:v1 --push .Everything below refers to dheerajsai15/cpu-burner:v1. Substitute your own image name wherever it appears, or pull mine and skip the build.
The Deployment and Service, app.yaml:
apiVersion: apps/v1
kind: Deployment
metadata:
  name: burner
spec:
  replicas: 2
  selector:
    matchLabels:
      app: burner
  template:
    metadata:
      labels:
        app: burner
    spec:
      containers:
        - name: burner
          image: dheerajsai15/cpu-burner:v1
          ports:
            - containerPort: 3000
          resources:
            requests:
              cpu: 200m
              memory: 64Mi
            limits:
              cpu: 200m
              memory: 128Mi
---
apiVersion: v1
kind: Service
metadata:
  name: burner
spec:
  selector:
    app: burner
  ports:
    - port: 80
      targetPort: 3000
No type: on the Service, so it’s a ClusterIP. Internal only, and no load balancer on the bill. We’ll drive it from inside the cluster.
kubectl apply -f app.yaml
kubectl top pods -l app=burner
NAME CPU(cores) MEMORY(bytes)
burner-7c94b8d6f5-jd2kn 1m 28Mi
burner-7c94b8d6f5-x9plt 1m 27MiIdle at 1m each against a 200m request. Requests and limits are equal, so these pods are Guaranteed, and each one can consume at most a fifth of a core no matter how hard it’s pushed. Two ceilings sit above these pods. Node runs your JavaScript on a single thread, so this app could never pass 1000m however hard you pushed it. The 200m limit holds it to a fifth of that. The limit is the one doing the work here, not the language.
4. The HorizontalPodAutoscaler
hpa.yaml:
apiVersion: autoscaling/v2
kind: HorizontalPodAutoscaler
metadata:
  name: burner
spec:
  scaleTargetRef:
    apiVersion: apps/v1
    kind: Deployment
    name: burner
  minReplicas: 2
  maxReplicas: 10
  metrics:
    - type: Resource
      resource:
        name: cpu
        target:
          type: Utilization
          averageUtilization: 50
scaleTargetRef names the object whose replicas field the HPA is allowed to write. minReplicas and maxReplicas bound it. The metrics list says what to watch.
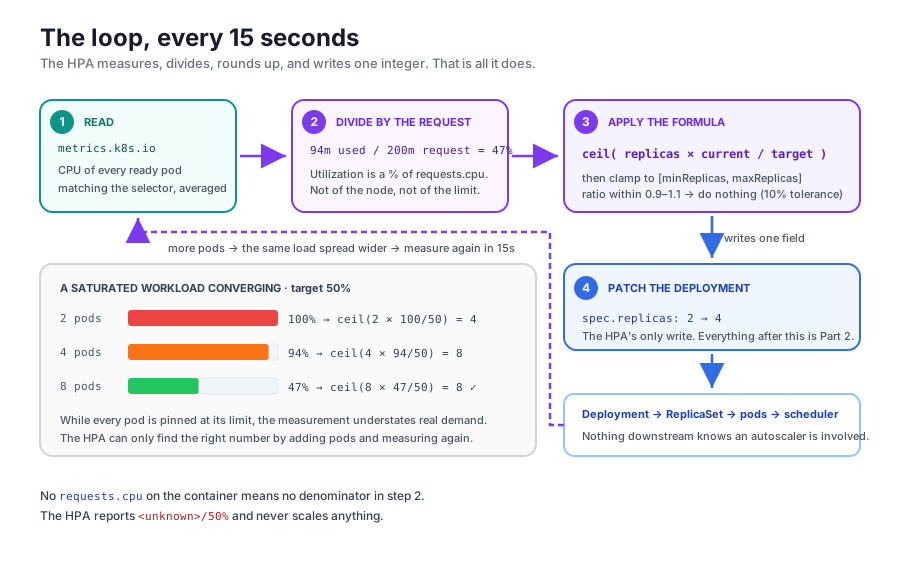
averageUtilization: 50 is a percentage of the request, not of the node. Our pods request 200m, so the target is 100m of CPU per pod. Change the request to 400m without touching the HPA and the target becomes 200m, with nothing to warn you. This is why the HPA is useless without requests set. With no request there’s no denominator, and the HPA reports <unknown>/50% alongside a FailedGetResourceMetric event.
The controller runs a loop every 15 seconds. Each pass it reads current usage from metrics.k8s.io, averages it across the ready pods, and evaluates one formula:
desiredReplicas = ceil( currentReplicas × ( currentMetricValue / desiredMetricValue ) )Because the current value is an average across the pods, there’s an equivalent reading that’s easier to do in your head. Add up the utilisation of every pod and divide by the target.
Two pods at 70% and 80%, target 50%:
(70 + 80) / 50 = 3 replicasThree pods at 40%, 20% and 10%, same target:
(40 + 20 + 10) / 50 = 1.4 → 2 replicasSame formula, and it makes the shape obvious. The HPA divides total demand by how much demand you’re willing to put on one pod.
The HPA clamps the result to [minReplicas, maxReplicas] and writes it to the Deployment’s replicas field. It does nothing else. From there it’s the machinery from Part 2. The Deployment updates its ReplicaSet, the ReplicaSet creates pods, the scheduler places them.
One guard sits on the formula, a tolerance of 10%. If the ratio lands between 0.9 and 1.1, the HPA does nothing. Without it, a workload sitting at 51% would scale up, drop to 48%, scale down, and oscillate forever.
metrics is a list, and you can put several entries in it. The HPA evaluates each one, then takes the largest answer. It scales up if any metric is above its target, and only scales down when every metric is below.
kubectl apply -f hpa.yaml
kubectl get hpa
NAME REFERENCE TARGETS MINPODS MAXPODS REPLICAS AGE
burner Deployment/burner cpu: 1%/50% 2 10 2 30s1%/50% is current utilization against target. If it reads <unknown>/50% for more than a minute, metrics-server isn’t returning data for these pods.
5. Scaling out
Now generate load. loadtest is the easiest way to do it, run from a pod inside the cluster so it can reach the ClusterIP Service:
kubectl run loadgen --image=node:20-alpine --restart=Never -- \
  sh -c "npm i -g loadtest && loadtest -c 20 --rps 30 http://burner"
Taking that apart:
| Part | What it does |
|---|---|
kubectl run loadgen | Creates a single pod named loadgen. No Deployment, no ReplicaSet |
--image=node:20-alpine | Runs it from the Node 20 Alpine image, chosen because it already ships npm |
--restart=Never | Sets restartPolicy: Never. If the container dies, it stays dead |
-- | Everything after this belongs to the container, not to kubectl |
sh -c "..." | Starts a shell and hands it the whole string as one command line |
npm i -g loadtest | Installs the load tool. The image doesn’t ship with it |
&& | Only start the test if the install succeeded |
-c 20 | Keeps 20 connections open at once |
--rps 30 | Aims for 30 requests a second across all of them |
http://burner | The target, resolved by cluster DNS to the Service |
The -- is there because kubectl run and the container command compete for the same argument list. Without it, kubectl reads -c 20 as one of its own flags and errors out. The sh -c is there because a container command is normally one executable plus arguments, with no shell to interpret &&. Wrapping both commands in a shell is what lets them chain.
burner is the Service’s name, so the requests go to the Service on port 80, which forwards them to port 3000 on the pods behind it.
Each request burns 25ms of CPU, so 30 × 25ms = 750ms of CPU work arrives every second, which is 750m of CPU demand. The 100ms CFS period from section 1 plays no part in that number. It governs how a limit gets enforced, not how much work shows up. Every figure below falls out of the 750m.
Watch in another terminal:
kubectl get hpa burner -wNAME REFERENCE TARGETS MINPODS MAXPODS REPLICAS AGE
burner Deployment/burner cpu: 0%/50% 2 10 2 2m
burner Deployment/burner cpu: 100%/50% 2 10 2 2m15s
burner Deployment/burner cpu: 100%/50% 2 10 4 2m30s
burner Deployment/burner cpu: 94%/50% 2 10 4 3m
burner Deployment/burner cpu: 94%/50% 2 10 8 3m15s
burner Deployment/burner cpu: 61%/50% 2 10 8 3m45s
burner Deployment/burner cpu: 47%/50% 2 10 8 4m15sFollow the arithmetic:
- 2 pods. 750m of demand split two ways is 375m each, but the limit is 200m, so both pods pin there. Utilization is 200/200 = 100%.
ceil(2 × 100/50)= 4. - 4 pods. 750m / 4 = 188m each, now under the limit. 188/200 = 94%.
ceil(4 × 94/50)=ceil(7.52)= 8. - 8 pods. 750m / 8 = 94m each. 94/200 = 47%, and 47/50 = 0.94, inside the 10% tolerance, so the HPA stops. 8 it is.
kubectl top pods -l app=burnerNAME CPU(cores) MEMORY(bytes)
burner-7c94b8d6f5-2wfnr 95m 31Mi
burner-7c94b8d6f5-4z8ct 93m 30Mi
burner-7c94b8d6f5-jd2kn 94m 32Mi
...The jump from 2 to 4 to 8 isn’t the formula being clever. It’s the formula applied to a workload that starts out saturated. While every pod is pinned at its limit, the measurement can’t see how much demand is queued behind it, so the HPA can only discover the right number by adding pods and measuring again. Two cycles, thirty seconds.
6. Scaling back in
Kill the load:
kubectl delete pod loadgenCPU collapses within one scrape. The replica count does not:
NAME     REFERENCE           TARGETS       MINPODS   MAXPODS   REPLICAS   AGE
burner   Deployment/burner   cpu: 3%/50%   2         10        8          6m
burner   Deployment/burner   cpu: 0%/50%   2         10        8          8m
burner   Deployment/burner   cpu: 0%/50%   2         10        8          10m
burner   Deployment/burner   cpu: 0%/50%   2         10        2          11m
Five minutes at eight replicas doing nothing, then a drop straight to two. That’s the downscale stabilization window, five minutes by default. Before scaling down, the HPA looks at every recommendation it made over that window and takes the highest one. A single quiet scrape can’t shrink the Deployment. The traffic has to stay gone.
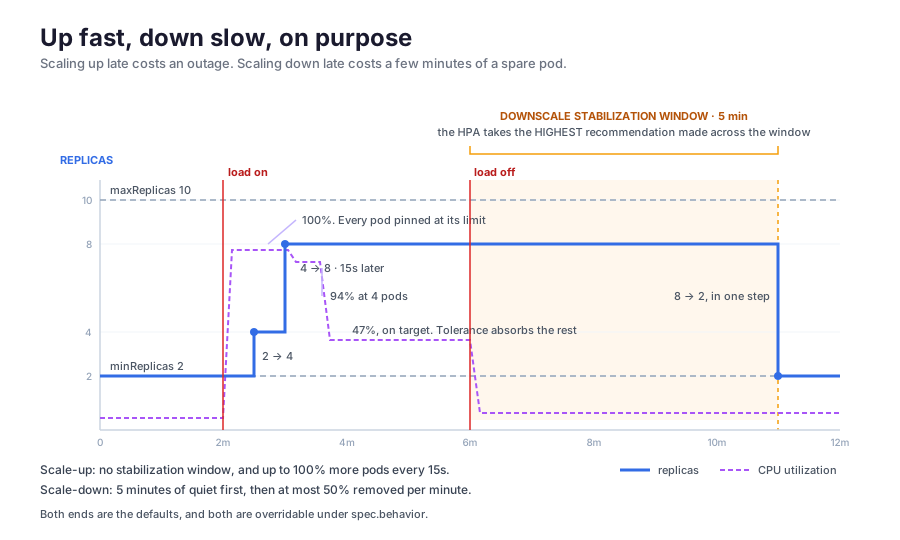
Scale-up has no such delay, and the asymmetry is deliberate. Scaling up late costs you an outage. Scaling down late costs you a few minutes of a spare pod. kubectl describe hpa burner shows the decisions:
Events:
  Type    Reason             Age    From                       Message
  ----    ------             ----   ----                       -------
  Normal  SuccessfulRescale  8m     horizontal-pod-autoscaler  New size: 4; reason: cpu resource utilization above target
  Normal  SuccessfulRescale  7m30s  horizontal-pod-autoscaler  New size: 8; reason: cpu resource utilization above target
  Normal  SuccessfulRescale  40s    horizontal-pod-autoscaler  New size: 2; reason: All metrics below target
Both directions are tunable through a behavior block:
spec:
  behavior:
    scaleDown:
      stabilizationWindowSeconds: 300
      policies:
        - type: Percent
          value: 50
          periodSeconds: 60
    scaleUp:
      stabilizationWindowSeconds: 0
      policies:
        - type: Percent
          value: 100
          periodSeconds: 15
Those values are the defaults written out. Scaling down removes at most half the pods per minute, after a five-minute quiet period. Scaling up can double the count every 15 seconds, immediately. A bursty API might want a longer scale-down window. A batch worker might want a gentler scale-up.
7. Where the HPA stops
Three limits sit on it.
It can only add pods, not machines. Raise maxReplicas past what your nodes can hold and the extra pods sit Pending with Insufficient cpu, the exact failure from section 1. Adding nodes is the Cluster Autoscaler, a separate component that watches for unschedulable pods and resizes the node pool. It’s already running on a managed cluster, and you can watch it decline. A NotTriggerScaleUp event reading pod didn't trigger scale-up: 1 max node group size reached means it looked, and your pool is fixed at its maximum.
It scales the wrong axis for some problems. A single-instance database doesn’t get faster with more replicas. It needs a bigger request. That’s the Vertical Pod Autoscaler, which rewrites requests and limits instead of the replica count. Don’t point a VPA and an HPA at the same CPU metric. They’ll fight, since the VPA moves the denominator the HPA is dividing by.
CPU is often the wrong signal. An app that spends its time waiting on a database is slow at 15% CPU, and the HPA will never notice. autoscaling/v2 accepts Pods and External metric types for things like requests per second or queue depth, but those need a metrics adapter, a Prometheus adapter or KEDA, sitting where metrics-server sits.
Wrapping up
Where we landed:
- A request is for the scheduler, a limit is for the kernel. The scheduler subtracts requests from a node’s allocatable capacity and never looks at real usage. The limit is a cgroup ceiling on the running container.
- CPU is time, not cores.
100mis 10ms of CPU per 100ms period. Exceed it and the kernel throttles you, slower but never killed. - Memory is not compressible. Exceed the memory limit and the container is
OOMKilledwith exit code 137. No warning, no graceful shutdown. - Allocatable is not capacity, and
PendingwithInsufficient cpuis a requests problem. The node’s requested budget is spent, regardless of how idle it looks. - metrics-server turns kubelet cgroup counters into a Kubernetes API. cAdvisor measures, metrics-server scrapes every 15s and holds one sample in memory, and the aggregation layer makes it
metrics.k8s.io. It’s a signal source, not a monitoring stack. averageUtilizationis a percentage of the request. No request means no denominator, which means no HPA.- The HPA runs one formula every 15 seconds.
ceil(replicas × current/target), clamped to min and max, with a 10% tolerance. Its only action is writing the Deployment’s replica count. - Scale-up is immediate, scale-down waits five minutes. Deliberately asymmetric, and both ends are tunable through
behavior.
Cleanup:
kubectl delete hpa burner
kubectl delete -f app.yaml
Then destroy the cluster. Nothing here provisioned a load balancer or a volume, so unlike Parts 4 and 6 there’s no orphaned resource to hunt down. The nodes still bill by the hour, though, whether or not anything runs on them.
The replica count is no longer a number we typed. Plenty still is, though. Every manifest across these seven posts has reached the cluster the same way, with one of us running kubectl apply -f and the cluster trusting whatever showed up. Nothing records what’s meant to be running, nothing notices when someone edits a live object by hand, and nothing stops the next person from applying a different version of the same file. The next post hands that job to Argo CD, where the cluster pulls its desired state from a git repo instead of waiting on somebody’s laptop.